Quantcast
Channel: Energy2D – Concord Consortium
Viewing all 45 articles
Browse latest View live

Energy2D: Interactive computational fluid dynamics

$
0
0

Computational fluid dynamics (CFD) uses numeric methods to study any natural phenomenon and solve any engineering problem related to fluid flow. It has been an indispensable tool for many engineers. Mature, powerful CFD products are available nowadays. While these products are very useful tools for engineers, they were not designed for kids to play with. Understandably, the business community lacks the financial incentive to push the agenda of making a product friendly to students for learning science and engineering. With all these years passed while CFD products got better and better, all the wisdom developed for modeling and understanding the natural and man-made systems never got spread to schools in a satisfactory scale.

This tragedy was, in part, caused by the unfortunate fact that few people in the education community had realized the enormous power of CFD for teaching science and engineering. Educators had a very good reason for not seeing it, because the power has never been brought close enough to matter in their professional careers. Most CFD tools are either too complicated to use or do not deliver the needed visual effects and user interfaces to matter. This is an issue that cannot be simply said solved by sending a demonstrator from the CFD community to the education community. Talking and showing are cheap. To bridge the gap, we need actions that will truly make a difference.

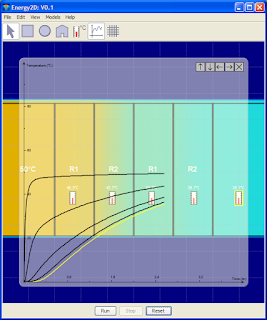
Supported by the National Science Foundation with an urgent need for educating young students with energy science and technology, we are developing a versatile CFD package suitable for teaching the scientific and engineering principles related to energy flow, particularly about energy-efficient passive solar buildings. The package consists of two programs called Energy2D and Energy3D, respectively, for the 2D and 3D versions of the CFD simulator.

Energy2D and Energy3D are based on solving the heat equation for modeling thermal conduction, coupled with the Navier-Stokes equation for modeling convection. A ray-tracing method is used to model radiation. The minimum requirement is that the simulation must run fast enough to be interactive so that students can play with it.

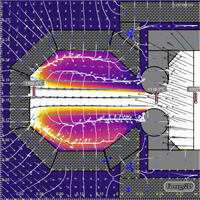
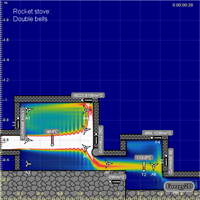
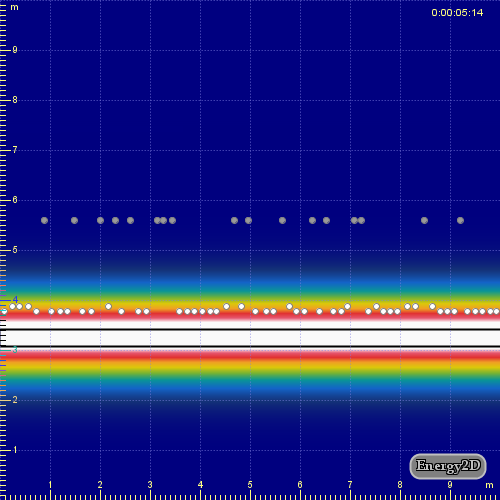
After a few weeks of work, I came up with a primitive version of Energy2D. The following two screenshots show that if the obstacle has a small cross section against the flow, turbulence will not occur.

It turned out that writing an unconditionally stable heat solver was not a big deal. After all, it is just a simple diffusion equation that can be easily solved using an implicit method.

Writing a fluid solver is more challenging as it is non-linear (which is where all the fun comes from). I played and tested Jos Stam's fluid solver, which is based on an unconditionally stable Semi-Lagrangian method that is also used in weather prediction. Unfortunately, the solver is covered by a pending patent that we didn't succeed in convincing the current patent owner to license to us in any way--open-source or not. So I had to give up Stam's method and sought to reinvent the wheel.

I implemented the MacCormack method, which turned out to work fine for now. Compared with the Semi-Lagrangian method that achieves its stability by overdamping the fluid, the MacCormack method has no overdamping problem so it has to suffer from the stability problem. As a side note, I also found that after using the vorticity confinement method to re-inject vorticity to the solution of the Semi-Lagrangian method to make it more turbulent, it would also suffer from the stability problem. There seems to be no free lunch in seeking a fast, yet accurate, fluid solver.


Comparing convection and conduction using Energy2D

$
0
0
The following are two Energy2D simulations that compare convection and conduction, which should run within this page if you have installed Java and Java applets are enabled with your browser. The first one shows the case of natural convection. The second one shows the case of forced convection.

Instruction: Click inside a simulation window. Press 'R' to  start or stop, 'T' to reset, 'L' to reload the initial configurations, and 'G' to open or close a graph. The virtual temperature sensors can be moved around, though most other pieces are locked to their positions. Right-click on the windows for more actions.

Natural convection (driven by thermal buoyancy):

Forced convection (driven by airflow):


A Von Kármán vortex street.
The following screenshot shows a typical Von Kármán vortex street produced from the second simulation. Energy2D is also capable of producing other interesting fluid patterns such as mushroom cloudsBernard's Cell, and the Kelvin–Helmholtz instability.

More generally, Energy2D is a Java application that allows users to create interactive, real-time simulations of heat and mass flow. A simulation you create can be easily placed on the Internet just like what you saw above.

On a separate note, below are two results for conduction simulations using Energy2D that illustrate the circuit analogy: Ohm's Law is the electrical analogy of Fourier's Law of Heat Conduction. It is interesting to note that Ohm actually drew considerable inspiration from Fourier's work on heat conduction in the theoretical explanation of his work (see Ohm's Law in Wikipedia). Ironically, today's students seem to be more familiar with Ohm's Law than Fourier's Law. So the circuit analogy is used in textbooks to help students understand heat conduction.

The analogy to a parallel circuit.
The analogy to a series circuit.

Rainbow, iron, and gray

$
0
0

Energy2D is our signature software for simulating invisible energy flow in natural and man-made systems. One of its view shows the temperature distribution calculated by the physics engine. This view renders images similar to what an infrared camera shows. Most IR cameras have a few color palettes for the user to choose. So I think we should provide those options in Energy2D, too.

This blog post shows the three color palettes commonly used in IR imagery that were implemented in Energy2D: rainbow, iron, and gray. I guess the IR folks call the second one "iron" because it looks like the color of an iron bar heated to glow.


A criticism of using colorful heat maps to visualize distributions is the possibility of twisting data and therefore creating illusions--because our perception of color does not go linearly with the linear increase of the RGB values. You can compare these three images and see if that is a problem.

I have blogged a lot about how great an inquiry tool IR imaging represents. The resemblance of Energy2D's temperature patterns to IR images indicates a learning possibility of using simulations to deliver some of the nice features that an IR camera gives--before the prices of IR cameras come down to a couple of hundred dollars.


If you would like to show how they look in real simulations, go to Energy2D's home page and explore from there.


Energy2D: Computational fluid dynamics at your fingertips

$
0
0
Online Energy2D simulations
Energy2D is our signature software for simulating heat transfer and fluid dynamics. Fifty online simulations are now available to the world through Energy2D's website. These simulations run speedily on most computers, bringing a vivid, colorful world of science to your computer screen and allowing you to experiment with them.

All these simulations can be downloaded for editing, provided that you have also installed the standalone Energy2D software on your computer (you don't need it to run the online simulations--only when you need to edit or create a simulation will you need to install it). The editing interface still has limited functionalities, but we are hoping to make it ten times better in the future.

One of our next steps is to make a version that runs on Android. This will allow the simulations you have created to run on tablets and smartphones as well. Work is also underway to include other energy flows and transformations to enrich the natural phenomena it can simulate, and to integrate data from sensors to enable richer user interfaces.

The National Science Foundation provides the funding to make this possible.

Augmented reality thermal imaging

$
0
0
IR: Watch the YouTube video
Augmented reality (AR) presents a live view of the real world whose elements are augmented by computer-generated data such as sound or graphics. The technology promises to enhance the user's current perception of reality. AR is considered as an extension of virtual reality (VR). But unlike VR that replaces the real world with a simulated one, AR bridges and takes advantage of the real world and the simulated world.

Augmentation is conventionally in real-time and in semantic context with environmental elements. With the help of AR technology, the information about the surrounding real world of the user becomes digitally manipulable. Artificial information about the environment and its objects can be overlaid on the real world to achieve seamless effects and user experiences.

Our NSF-funded Mixed-Reality (MR) Labs Project has set out to explore how AR/MR technologies can support "augmented inquiry" to help students learn abstract concepts that cannot be directly seen or felt in purely hands-on lab activities.

AR: Watch the YouTube video
One of the first classes of prototype we have built is what we call "Augmented Reality Thermal Imaging." The concepts related to heat and temperature are somehow difficult to some students because thermal energy is invisible to the naked eye. Thermal energy can now be visualized using infrared (IR) imaging. But we have developed AR technology that provides another means of "seeing" thermal energy and its flow.

The first image in this post shows an IR image of a poster board heated by a hair dryer. The second image shows a demo of AR thermal imaging: When a hair dryer blows hot air to a liquid crystal display (LCD), the AR system reacts as if hot air could flow into the screen and leave a trace of heat on the screen, just like what we see in the IR image above. You may click the links below the images to watch the recorded videos.

The tricky part of MR Labs is that, in order to justify the augmentation of a computer simulation to a physical activity, the simulation should be a good approximation of what happens in the real world. We used our computational fluid dynamics (CFD) program, Energy2D, to accomplish this. There are many more demos of MR Labs using Energy2D, which can be viewed at this website.


Investigating the Kármán vortex street using Energy2D

$
0
0
Run this simulation.
The Kármán vortex street is a repeating pattern of swirling vortices caused by the unsteady separation of flow of a fluid over bluff bodies. It is named after the great scientist Theodore von Kármán who co-founded NASA's JPL. This effect is observable in nature like in a stream, but you need some luck since it requires some picky conditions that are not always there for you.

Now, with our online simulation program Energy2D you can create and investigate the Kármán vortex street in your browser without depending on Mother Nature to give you an opportunity window.

For example, you can test how big an obstacle should be in order to produce this effect. You will find that an obstacle must be large enough to create a steady vortex street. If the shape of the obstacle is not streamlined, what will you see?

If you stick a thermometer in a thermal vortex street, you should see that the temperature will swing pretty regularly between a high value and a low value (see the image to the right). This means this effect could be used to warm and cool an array of things periodically. Could there be some engineering use of this?

Two Interactive Features Added to Energy2D

$
0
0
Energy2D is our signature software for heat transfer and fluid dynamics simulations. Written in Java, it runs speedily either as a standalone app on your desktop or an embedded applet within a browser. It is actively being developed to meet the need of energy education to have an interactive and constructive learning environment based on rigorous scientific principles. Energy2D is already a highly interactive system--you can change anything that is allowed to change by the author of a simulation while it is running. Recently, I have added two new features to make it even more interactive. Both features apply to all existing Energy2D simulations I (or you) have created.

The first one is a "heat dropper," a mode in which the user can click or drag the mouse to add or remove heat from the location in the model that the mouse points to. If you have a touch screen, you can touch or swipe your finger across it and the heat dropper works as if your finger could give heat to the virtual space in the simulation. The first video in this blog post shows how it works.

The second one is a "field reader," a mode in which the user can move the mouse to read the value of a property distribution field at the location the mouse points to. Currently, the supported property fields include temperature, thermal energy, and fluid velocity (which will be zero in a solid). The second video shows how it works.

If a web page that embeds an Energy2D applet doesn't already have a drop-down menu on the page for you to switch to these modes, you can always access them through the View Options dialog window. The View Options menu can be found if you right-click on a spot in the simulation window that is not occupied by a model component (like a polygon or a sensor).

Thermostats in Energy2D

$
0
0
A thermostat is a controller that maintains a system's temperature near a fixed point. The simplest thermostat does this by switching a heater or AC on and off to maintain the desired temperature (known as the bang-bang control). I spent a couple of days adding thermostats to Energy2D and developing a simple GUI for setting up thermostats.

In Energy2D, a thermostat is a connection between a power source and a thermometer. A thermometer can be linked to any number of power sources, but a power resource can only be linked to one thermometer. In the property window of a thermometer, the user can select the power sources it will control.

This Energy2D model demonstrates how a thermostat works. Turn on the temperature graph. Let the simulation run for a few cycles and then turn on the sunlight. Compare the behavior of the temperature graph. You can also try to move the temperature sensor around to examine how the on/off time of the thermostat depends on its location.

You should discover from this simulation that, when the sun shines on the house, it ends up using less energy to maintain the inside temperature because the time that the heater is on is shorter (see the differences of the two graphs in the first two images of this post). You should also find out why we should not put the sensor of a thermostat near a window.

The third image shows multiple thermostats at work to create different heating zones. This Energy2D simulation has four heaters in three rooms, each of which is controlled by a thermostat. 

From these demos of thermostats in Energy2D, you can see the richness of the software. I will add more useful features like this to make Energy2D even better. Stay tuned!

Energy2D V1.0 released!

$
0
0
The first stable version of Energy2D, an open-source and free heat transfer simulation tool made possible by funding from the National Science Foundation, is now available for download. The program can be installed as a desktop app, which can be used to create high-quality simulations that can be deployed on the Internet as applets. It comes with about 40 templates to help you get started to design your own simulations. The Energy2D website provides plenty of examples that show how you can integrate your simulations on your websites. The examples cover a wide range of topics in heat transfer, fluid dynamics, and thermal engineering. Thermal engineering is a major feature added recently and will be expanded in the future. The example to the right, "How solar cycles affect the duty cycle of a thermostat," showcases this new feature.

When you click the "Java Webstart Installer" on the website, the software will be automatically downloaded and installed on your desktop. The website's Download page has detailed information for how to publish your Energy2D simulations or integrate them with your web stuff.

If you have used the Energy2D app before, you will need to remove the previous installation in order to enjoy the convenience of full OS integration that this version offers. For Windows users, go to "Control Panel > Java." For Mac users, go to the Java Preference. In either case, you can find the previous installation in "Temporary Internet Files."

If you have just used the online applets on our website but haven't downloaded the app, there is nothing you need to remove. Although it is perfectly fine to use the online applets as they are, we think you should try the app--It will give you the full ability to create, design, and test.

The first Earth science simulation in Energy2D is here: Mantle convection!

$
0
0
It is my goal to make the Energy2D software a powerful simulation tool for a wide audience. Last week I have added some engineering examples and blogged about them.

Last night I came up with an idea for simulating mantle convection, the slow creeping motion of Earth's rocky mantle caused by convection currents carrying heat from the interior of the Earth to the surface. It turned out that the idea worked out.
 
This blog post demonstrates the first geoscience simulation created using Energy2D. The two screenshots show mantle convection at different times. The streamlines in the second image represent the convective currents. From the simulation, you can see the gradual cooling of the core due to mantle convection--This happens in the time frame of billions of years, but a computer simulation can show it in a few seconds. For simplicity, we don't distinguish the inner core and the outer core in this model. Later, we can build a more complex one that includes these subtle details.

The simulation is available online at: http://energy.concord.org/energy2d/mantle.html. Take a look and stay tuned for more Earth science simulations--brought to you by Energy2D!

Energy2D to reach thousands of schools

$
0
0
Thermoregulation
Project Lead The Way (PLTW) is the leading provider of rigorous and innovative Science, Technology, Engineering, and Mathematics (STEM) education curricular programs used in middle and high schools across the US. The PLTW Pathway To Engineering (PTE) program includes a foundational course called the Principles of Engineering (POE) designed for 10-11th grade students. PLTW curriculum currently reaches 4,780 schools.

According to Bennett Brown, Associate Director of Curriculum and Instruction of PLTW, our Energy2D software will be adopted in the POE curriculum to support a variety of core engineering concepts including power, energy, heat transfer, controls, and environmental factors.
Solar heating cycles

Since the release of the first alpha version in 2011, Energy2D has already been used by thousands of users worldwide, but the collaboration with PLTW will be a big step forward for Energy2D to reach more students. The timing of this collaboration is particularly important to engineering tools such as Energy2D, as--for the first time--engineering has been officially written into the US K-12 Science Education Standards. Once the Standards roll out, thousands of teachers will be looking for leading-edge tools that can help them teach engineering. This will be a great opportunity for Energy2D.

Why is Energy2D so special that people want to use it? Our website provides many self-explanatory examples. But there is one hidden gem I want to emphasize here: Its computational engine is based on good algorithms I devised specially for this simulator. Its heat solver can be so accurate that a simulation can maintain the total energy of an isolated system at a level as accurate as 99.99% for as long as it runs, regardless of the complexity of the structures in the system! The fact that the sum of energy from all the 10,000 grid cells remains a constant after billions of individual calculation steps reflects the holy grail of science and engineering. If anything, engineering is about accuracy. A good engineering tool should be able to give students a good engineering habit of mind and accuracy should be a paramount part of it.

Using Energy2D to simulate Trombe walls

$
0
0

A Trombe wall is a sun-facing wall separated from the outdoors by glass and an air space. It consists a solar absorber (such as a dark surface) and two vents for air in the house to circulate through the space and carry the solar heat to warm the house up. In a way, a Trombe wall is like a machine that uses air as a convey belt of thermal energy harvested from the sun. Trombe walls are very simple and easy to make and are sometimes used in passive solar green buildings.


Hiding sophisticated power of computational fluid dynamics behind a simple graphical user interface, our Energy2D software can easily simulate how a Trombe wall works. The two images in this blog post show screenshots of a Trombe wall simulation and its closeup version. You can play the simulation on this page and download the models there. If you open the models using Energy2D, you should be able to see how easy it is to tweak the models and create realistic heat flow simulations.

Solar chimneys operate based on similar principles. Energy2D should be able to simulate solar chimneys as well. Perhaps this would be a good challenge to you. (I will post a solar chimney simulation later if I figure out how to do it.)

Using Energy2D to simulate solar updraft towers

$
0
0
The day/night cycle of an SUT
The solar updraft tower is a new-concept clean energy power plant for generating electricity from the sun. Sunshine falling on a greenhouse collector structure around the base of a tall chimney heats the air within it. The resulting convection causes air to rise up in the tower, driving wind turbines to produce electricity. In 2011, a plan of building a massive solar updraft tower in Arizona was announced (for more information, see this CNN report: Can hot air be the free fuel of the future?).

Compared with other solar technologies, solar updraft towers have many significant advantages. For example, it does not require water; it can be built in barren areas; it can still generate electricity after dark; its lifetime is much longer than solar panel arrays; and so on. Engineering-wise, it is a sound concept. The rest is a political will to get it banked and constructed. Let's hope it wouldn't take too long.
Streamline analysis of air intake

Instead of waiting for it to come true, why not go to our Energy2D website and see a bunch of simulations? You can even start to investigate it with our powerful Energy2D software. For example, you can turn the sunlight on and off to investigate how the heat absorbed during the day can still be released at night to drive the turbines. You can adjust the height of the tower to get an idea of why engineers want to build an insanely tall tower that rivals the height of Burj Khalifa in Dubai, the tallest building in the world. You can even use Energy2D's comprehensive analysis tools to study what happens when you block one of the air intake entrances.

The opportunities of inquiry with Energy2D are practically endless. You don't have to wait for someone to erect a solar updraft tower to explore about the technology -- you can do it now and the concept of a new technology is only a few mouse clicks away from you. Why not show these simulations and your investigations to your students to get them interested in clean energy today?

Engineers use Energy2D to simulate rocket mass heaters

$
0
0
Link to simulation
A rocket mass heater is an innovative and highly efficient space heating system, which is popular among natural building DIYers since its invention in 1970s. A number of engineers who are interested in rocket stove design have used our Energy2D software to visualize the thermal physics involved.
Link to simulation

Martin Karl Waldenburg from Germany has designed a series of simplified rocket stove simulations. With his permission, we have published his simulations on our Energy2D website. This blog post provides links to three of his simulations. Another one was created by Pinhead of the Rocket Stove Forum (who also gave us permission to publish his simulation).

Link to simulation
Link to simulation
Since Energy2D hasn't supported chemical reactions yet, in all these simulations, burning is simulated using a heater with a fan to approximate the driving pressure due to combustion.

We will continue to work on Energy2D's computational engine and improve its graphical user interface. Currently, we are plowing through the math needed to model thermal radiation, chemical reactions, and phase changes. Once these features are added, we hope more people will find it useful, educational, and entertaining.

Season’s greetings from Energy2D

$
0
0
I have been so swamped in fund raising these days that I haven't been able to update this blog for more than two months. Since it is the time of the year again, I thought I should just share a holiday video made by Matthew d'Alessio, a professor at California State University Northridge, using our signature software Energy2D.

The simulator currently attracts more than 5,000 unique visitors each month, a number that probably represents a sizable portion of engineering students studying the subject of heat transfer on the planet. Over the past year, I have received a lot of encouraging emails from Energy2D's worldwide users. Some of them even compared it with well-known engineering programs. Franco Landriscina at the University of Trieste has written Energy2D into his recent Springer book "Simulation and Learning: A Model-Centered Approach."

I am truly grateful for these positive reactions. I want to say "Thank You" for all your nice words. There is nothing more rewarding than hearing from you on this fascinating subject of fluid dynamics and heat transfer. Rest assured that the development of this program will resume irrespective of its funding. In 2014, I hope to come up with a better radiation solver, which I have been thinking for quite a long time. It turns out that simulating radiation is much more difficult than simulating convection!

Here is a tutorial video in Spanish made by Gabriel Concha.

Dart projects of Energy2D and Quantum Workbench announced

$
0
0
Last month, Google announced Dart 1.0, a new programming language for the Web that aims to greatly accelerate Web development. Dart uses HTML5 as the UI. It can either run on the Dart Virtual Machine being built in Chrome or be compiled into JavaScript to run in other browsers. Dart can also be used to create standalone apps (I guess it is meant to be the main programming language for Google's own Chrome OS) or server-side software. An ECMA Technical Committee (TC 52) has been formed to make Dart into an international standard.

This is the moment I have been waiting for. As a developer with C/Java background, I am not convinced that JavaScript is made for large, complex projects (as Web programming seems to be moving towards) -- even after reading many articles and books about JavaScript. The facts that after ten years Google Docs still has only a tiny fraction of functionality of Word and basic functions such as positioning an image have not improved much suggest that its JavaScript front end has probably reached its limit.

Don't get me wrong. JavaScript is an excellent choice for creating interactive Web experiences. I use JavaScript extensively to create Web interfaces for interacting with the Energy2D applet. But I think it is in general healthy for the developer community if we are given more options. Recognizing the weaknesses of JavaScript, the community has already created CoffeeScript and TypeScript (supersets of JavaScript that strips off unproductive features of JavaScript) that also require compilation into native JavaScript. Dart is Google's solution to these problems that should be welcomed. To a Java developer like me, Dart provides a much better option because it returns the power of class-based object-oriented programming to developers who must create Web-based front ends. What is even sweeter is that its SDK provides a familiar Eclipse-based programming platform that makes many developers feel at home.

Excited about the potential of this new language (plus it is from Google and will be highly performant on Chrome), I am announcing the development of the Dart versions of our Energy2D and Quantum Workbench software. These software are based on complex mathematical solutions of extremely complex partial differential equations and will hopefully provide some showcases to anyone interested in Dart. This is not to say the development of the Java versions will cease. On the contrary, I plan to convert the GUIs from Swing to JavaFX so that they will run on all major platforms including iOS and Android (rumor has it that Java 8, which is scheduled to be released in March, will come with JVMs for iOS and Android).

Hopefully 2014 will be an exciting year for us!

Fireplaces at odd with energy efficiency? An Energy2D simulation

$
0
0
In the winter, a fireplace is the coziest place in the house when we need some thermal comfort. It is probably something hard to remove from our living standards and our culture (it is supposed to be the only way Santa comes into your house). But is the concept of fireplace -- an ancient way of warming up a house -- really a good idea today when the entire house is heated by a modern distributed heating system? In terms of energy efficiency, the advice from science is that it probably isn't.

Figure 1. A fire is lit in the fireplace.
When the wood burns, a fireplace creates an updraft force that draws the warm air from the house to the outside through the chimney. This creates a "negative pressure" that draws the cold air from the outside into the house through small cracks in the building envelope. This is called the stack effect. So while you are getting radiation heat from the fireplace, you are also losing heat in the house at a faster rate through convection. As a result, your furnace has to work harder to keep other parts of your house warm.

Figure 2. No fire.
Our Energy2D tool can be used to investigate this because it can simulate both the stack effect and thermostats. Let's just create a house heated by a heating board on the floor as shown in the figures in this article. The heating board is controlled by a thermostat whose temperature sensor is positioned in the middle of the house. A few cracks were purposely created in the wall on the right side to let the cold air from the outside in. Their sizes were exaggerated in this simulation.

Figure 1 shows the duty cycles of the heating board within two hours when the house was heated from 0 °C to 20 °C with a fire lit in the fireplace. A heating run is a segment of the temperature curve in which the temperature increases, indicating the house is being heated. In our simulation, the duration of a heating run is approximately the same under different conditions. The difference is in the durations of the cooling runs. A more drafty house tends to have shorter cooling runs as it loses energy more quickly. Let's just count those heating runs. Figure 1 shows that 15 heating runs were recorded in this case.

Figure 2 shows the case when there was no fire in the fireplace and the fireplace door was closed. 13 heating runs were recorded in this case.

What does this result mean? This means that, in order to keep the house at 20 °C, you actually need to spend a bit more on your energy bill when the fireplace is burning. This is kind of counter-intuitive, but it may be true, especially when you have a large drafty house.

Figure 3. In a house without cracks...
How do we know that the increased energy loss is due to the cracks? Easy. We can just nudge the window and the wall on the right to close the gaps. Now we have a tight house. Re-run the simulation shows that  only 11 heating runs were recorded (Figure 3). In this case, you can see in Figure 3 that the cooling runs lasted longer, indicating that the rate of heat loss decreased.

Note that this Energy2D simulation is only an approximation. It does not consider the radiation heat gain from the fireplace. And it assumes that the fire would burn irrespective of air supply. But still, it illustrates the point.

This example demonstrates how useful Energy2D may be for all precollege students. In creating this simulation, all I did is to drag and drop, change some parameters, run the simulation, and then count the heating runs. As simple as that, this tool could be a game changer in science and engineering education in high schools or even middle schools. It really creates an abundance of learning opportunities for students to experiment with concepts and designs that would otherwise be inaccessible. Similar experiences are currently only possible at college level with expensive professional software that typically cost hundreds or even thousands of dollars for just a single license. Yet, according to some of our users, our Energy2D rivals those expensive tools to some extent (I would never claim that myself, though).

Getting sensor data out of Energy2D

$
0
0
Figure 1: Copy data from Energy2D.
Since a few users asked if the simulation data in Energy2D can be exported to other applications such as Excel, I have added a feature to the app for extracting virtual sensor data as multi-column time series data. For the user's convenience, there are three different ways of getting these data:
  1. When right-clicking on a sensor, the "View Data..." from the popup menu returns the data that has been recorded by the selected sensor.
  2. When right-clicking on a spot not occupied by a sensor, the "View Data..." from the popup menu returns a tabbed pane that contains all the sensor data -- different types of sensor are organized in different tabs.
  3. When the translucent graph is open, clicking the View Data button on the graph window's control panel returns the data recorded by all the sensors of the selected type, in consistent with the current display of the data in the graph window.
Figure 2: Paste data into Excel.
Regardless of which way you use, use the "Copy Data" button at the bottom of the data window to copy the data (Figure 1) and paste it into Excel. Once you get the data into Excel, you can process and plot them in any way you want (Figure 2). This feature is very handy if you need to combine data from multiple simulations into a single graph.

Note: This feature only works for the app. For security reason, the embedded applet is not allowed to access the System Clipboard (this is understandable, because people often copy and paste important information!)

Temperature change may not represent heat transfer; heat flux does.

$
0
0
Figure 1 (go to simulation)
There has been some confusion lately about the heat transfer representations in Energy2D simulations. By default, Energy2D shows the temperature distribution and uses the change of the distribution to visualize heat flow. This is all good if we have only one type of medium or material. But in reality, different materials have different thermal conductivities and different volumetric heat capacities (i.e., the ability of a given volume of a substance to store thermal energy when the temperature increases by one degree; the volumetric heat capacity is in fact the specific heat multiplied by the density).

A
Figure 2 (go to simulation)
According to the Heat Equation, the change of temperature is affected by the thermal diffusivity, which is the thermal conductivity divided by the volumetric heat capacity (now that I have written the terminology down, I can see why these terms are so confusing). In general, a higher thermal conductivity and a lower volumetric heat capacity will both result in faster temperature change.

To illustrate my points, Figure 1 shows a comparison of temperature changes in two materials. The pieces that have the same texture are made of the same material. The upper ones have a lower thermal conductivity but a higher thermal diffusivity. The lower ones have a higher thermal conductivity but a lower thermal diffusivity. In both upper and lower setups, the piece on the left side maintains a higher temperature to provide the heat source. Everything else starts with a low temperature initially. The entire container is completely insulated -- no heat in, no heat out. Two thermometers are placed just at the right ends of the middle rods. Their results show that the temperature rises more quickly in the upper setup (Figure 1) -- because it has a higher diffusivity.

The fact that something diffuses faster doesn't mean it diffuses more. In order to see that, we can place two heat flux sensors somewhere in the rods to capture the heat flows. Figure 2 shows the results from the heat flux sensors. Obviously, there is a lot more heat flow in the lower setup in the same time period.

Figure 3 (go to simulation)
The conclusion is that it is the heat flux, not the temperature change, that ultimately measures heat transfer. If you want to know how fast heat transfer occurs, the thermal conductivity is a good measure. However, if you want to know how fast temperature changes, the thermal diffusivity is a good measure. This may be also important to remember for those who use infrared cameras: Infrared cameras only measure temperature distribution, so what we really see from infrared images is actually thermal diffusion and thermal diffusion alone could be deceiving.

Figure 4 (go to simulation)
To make this even more fun (or confusing), let's replace the pieces on the right of the container with two pieces that are made of the same material that has a volumetric heat capacity between those of the other upper and lower ones. You wouldn't think this change would affect the results, at least not qualitatively. But the truth is that, the temperature in the lower setup in this case rises more quickly than the temperature in the upper setup -- exactly opposite to the case shown in Figure 1! The surprising result indicates how unreliable temperature change may be as an indicator of heat transfer. In this case, the temperature field of the middle rod is affected by what it is connected with. If we look at the results from the heat flux sensors (Figure 4), the heat flux that goes through the rod is much higher in the lower setup. This once again shows that heat flux is a more reliable measure of heat transfer.

In Energy2D, we have implemented an Energy Field view to supplement the Temperature Field view to remedy this problem.

Towards a multiphysics Energy2D

$
0
0
Figure 1: Particle motions driven by convective flow.
Up to yesterday, our Energy2D software has been a program for simulating, mostly, fluid and heat flows. But there are also objects in the world that are not fluids. To simulate that part of the world, we have to incorporate some other physics. A simple addition is to couple particles with fluids. This technique is commonly known as discrete phase modeling in the CFD community. It is used to model things such as suspension particles in fluids.

Figure 2: Heat traces of fireballs.
The latest version of Energy2D has a particle solver and a particle editor. Particles in Energy2D observe collision dynamics among themselves and interact with fluid and heat flows: particles can not only be moved by the fluid but also exert reaction force and transfer heat to the fluid. Figure 1 shows the motion of two types of particles driven by a convective flow. Depending on its density (relative to the fluid density), a particle may be buoyant enough to flow with the fluid or so heavy that it must sink to the bottom. This is shown in Figure 1: The black particles are the heavy ones and the white ones are the light ones; the convective force is not strong enough to move the black ones.

Particles can also transfer physical properties such as energy and momentum to the fluid while they are moving. Figure 2 shows the heat traces left by fireballs of different sizes.

Figure 3: Thermophoresis (Soret's effect)
With this new capacity, we can simulate phenomena such as thermophoresis, in which the different particle types in a mixture respond to a temperature gradient differently and thereby can be separated by just heating them up.

If you are enticed enough to want to see these simulations at work, click the links below the figures.

These new features represent an overdue step towards making Energy2D a versatile multiphysics simulation system. For engineering simulations, multiphysics is essential as real-world problems are often complicated by more than one mechanisms, each driven by its own physics.

The particle dynamics shown here is very simple (just a weekend's work). In the long run, I expect that a generic contact dynamics engine such as that of Box2D will be implemented in Energy2D. Coupling the Eulerian and Lagrangian reference frames, this integration will make Energy2D more interesting and useful. That would be a critical step towards our goal for Energy2D to simulate as many energy-related natural phenomena as possible.
Viewing all 45 articles
Browse latest View live